Lecture 0: Intro to coding#
NYU Wagner - Python Coding for Public Policy#
Aidan Feldman
Please sign attendance sheet; close devices

Structure for today#
Intros
Intro to Python/code
Going over course info like the syllabus
Each class, we’ll take breaks roughly halfway through.
About me#
Coding since 2005 🖥
Government since 2014 🦅
Teaching since 2011 🎓
Also a modern dancer 💃 and cyclist 🚲
Day jobs#
Currently freelancing with the Colorado Behavioral Health Administration. In the past, have worked for:
Access these slides#
You can get there through Brightspace.
Survey#
[This study] found that the modern language aptitude test was the strongest predictor of how quickly people would learn to code in Python … language aptitude explained 43 percent, fluid reasoning explained 12.8 percent, … and numeracy just 6 percent [of the variance].
In other words: Being good at learning foreign languages is a better predictor for coding aptitude than being good at math.
Disclaimers#
Me#
Here to teach you to:
Understand the power of code
Not be afraid of code
Do a lot with just a little code
Troubleshoot
Google stuff
Terrible memory
Names
Not a statistician
You#
Are not going to:
Be good at coding seven weeks in
Understand everything the first time
Will want to throw your computer out a window at one or many points in the class
Celebrate the little victories
Will get out of it what you put into it
Why this class?#
Teaching style#
This has been the worst, most disorganized, most insulting course I have ever taken. The instructor should be ashamed of himself and his lack of care for the course or its structure. He has no business teaching children, let alone being a college professor. … The assignments are incredibly difficult (and unrelated) compared to the content of the course, and so students are required to essentially self-teach in order to do the assignments … For the amount of tuition I pay, I could have hired a private tutor to properly teach me Python.
Another student:
Prof. Feldman’s Github was very well-organized and self-explanatory. Overall loved the class and felt it was the right amount of difficulty to introduce policy folks to computer science.
🤷
Not fully flipped classroom, but on the spectrum.
This class / my teaching style isn’t for everybody. That’s ok.
Hopefully you’ll be able to tell quickly.
Spreadsheets vs. programming languages#
What do you like about spreadsheets?
Why spreadsheets#
The easy stuff is easy
Lots of people know how to use them
Mostly just have to point, click, and scroll
Data and logic live together as one
Why programming languages#
Data and logic don’t live together
Why might this matter?
More powerful, flexible, and expressive than spreadsheet formulas; don’t have to cram into a single line
=SUM(INDEX(C3:E9,MATCH(B13,C3:C9,0),MATCH(B14,C3:E3,0)))
Better at working with large data
Google Sheets and Excel have hard limits at 1-5 million rows, but get slow long before that
Reusable code (packages)
Automation
Side-by-side1#
Task |
Spreadsheets |
Programming Languages |
|---|---|---|
Loading data |
Easy |
Medium |
Viewing data |
Easy |
Medium |
Filtering data |
Easy |
Medium |
Manipulating data |
Medium |
Medium |
Joining data |
Hard |
Medium |
Complicated transforms |
Impossible2 |
Medium |
Automation |
Impossible2 |
Medium |
Making reusable |
Limited3 |
Medium |
Large datasets |
Impossible |
Hard |
These ratings are obviously subjective
Not including scripting, including Excel’s new Python+pandas support
Python vs. other languages#
Why are you taking this class instead of R or whatever else?
![]()
Python vs. other languages#
Good for general-purpose and data stuff
Widely used in both industry and academia
Relatively easy to learn
Open source
![]()
What is Python?#
A general-purpose programming language
Text that your computer understands
Usually saved in a text file
This is true of most programming languages
Popular for data analysis and data science
Where to Python#
Pyton can be run in:
A text file, using the
pythoncommand-
Various other tools are built around them
What we’ll be using for this class
Each can be on your computer (“local”), or in the cloud somewhere.
Try it!#
Go to python.org/shell
Do some math (after typing each line, press
Enterto submit)1 + 110 / 410 / 3Calculate the number of minutes in a year
Try to break it!#
It’s ok, you won’t hurt it.
What happened?
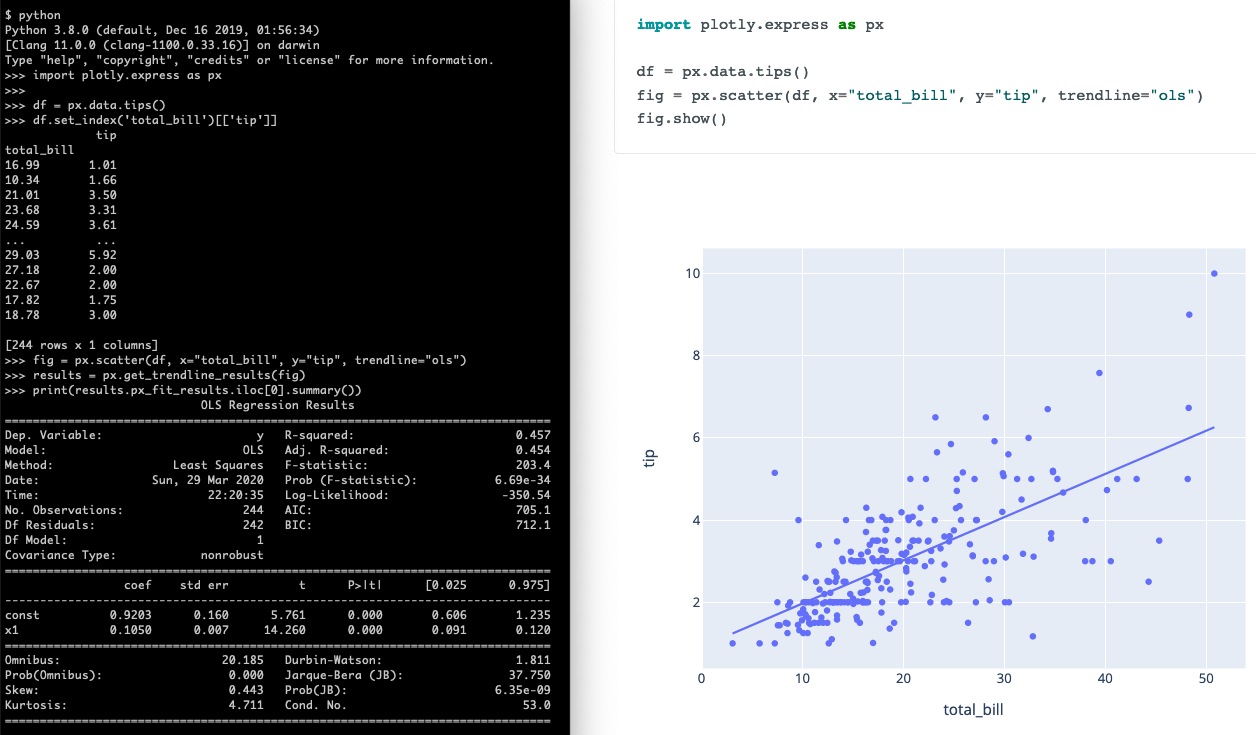
Jupyter#
Go to Google Colab
Create a notebook.
Paste in the following example.
Press the ▶️ button (or
Control+Enteron your keyboard).
import plotly.express as px

df = px.data.tips()
fig = px.scatter(df, x="total_bill", y="tip", trendline="ols")
fig.show()
FYI px.data.tips() loads one of Plotly’s sample datasets. You don’t need that when plotting other datasets.
Web based programming environment
Supports Python by default, and other languages with plugins
Nicely displays output of your code so you can check and share the results
Avoids using the command line
Avoids installation problems across different computers and operating systems
We’re using a service called Google Colab for its Jupyter/notebook functionality.
Command line vs. Jupyter#
Jupyter basics#
A “cell” can be either code or Markdown (text). Raw Markdown looks like this:
## A heading

Plain text

[A link](https://somewhere.com)
Running#
You “run” a cell by either:
Pressing the ▶️ button
Pressing
Control+Enteron your keyboard
Cells don’t run unless you tell them to, in the order you do so
Generally, you want to do so from the top every time you open a notebook
Output#
The last thing in a code cell is what gets displayed when it’s run
The output gets saved as part of the notebook
Just because there’s existing output from a cell, doesn’t mean that cell has been run during this session
Opening a class notebook#
Can use for:
Playing with examples
Taking notes
Computers are not smart.#
They do exactly what you tell them to do (not what you meant them to do) in the order you tell them to do it.
Fundamental programming concepts#
Objects#
Jelly
Jar of peanut butter
Knife
In code, they represent a “thing”, which often has associated actions.
Abstraction#
Verbs like:
“Open”
“Spread”
In code, known as functions/methods, which hide the details of what’s happening (the “implementation”). Similarly, “the sandwich” is an abstraction for an object, which contains other objects.
Pronouns/nicknames#
“It”
“PB”
In code, known as variables.
Variables:
Statistics: “any characteristics, number, or quantity that can be measured or counted,” which we’ll see as columns of tables
Programming: Buckets for values
Functions: Buckets for code
You’ll learn more about these in the homework
Variables and functions#
Make it possible to reuse the respective thing elsewhere
Should have names that are meaningful, for readability
Class materials walkthrough#
Politics/protests/war#
Accomodations#
Illness, childcare, mental health issues, etc.
Reach out via email
Homework 0#
Walk through the assignment