Lecture 4: Dates and time series analysis#
Please sign attendance sheet; close devices
Generative AI#
Reminder about the course policy.
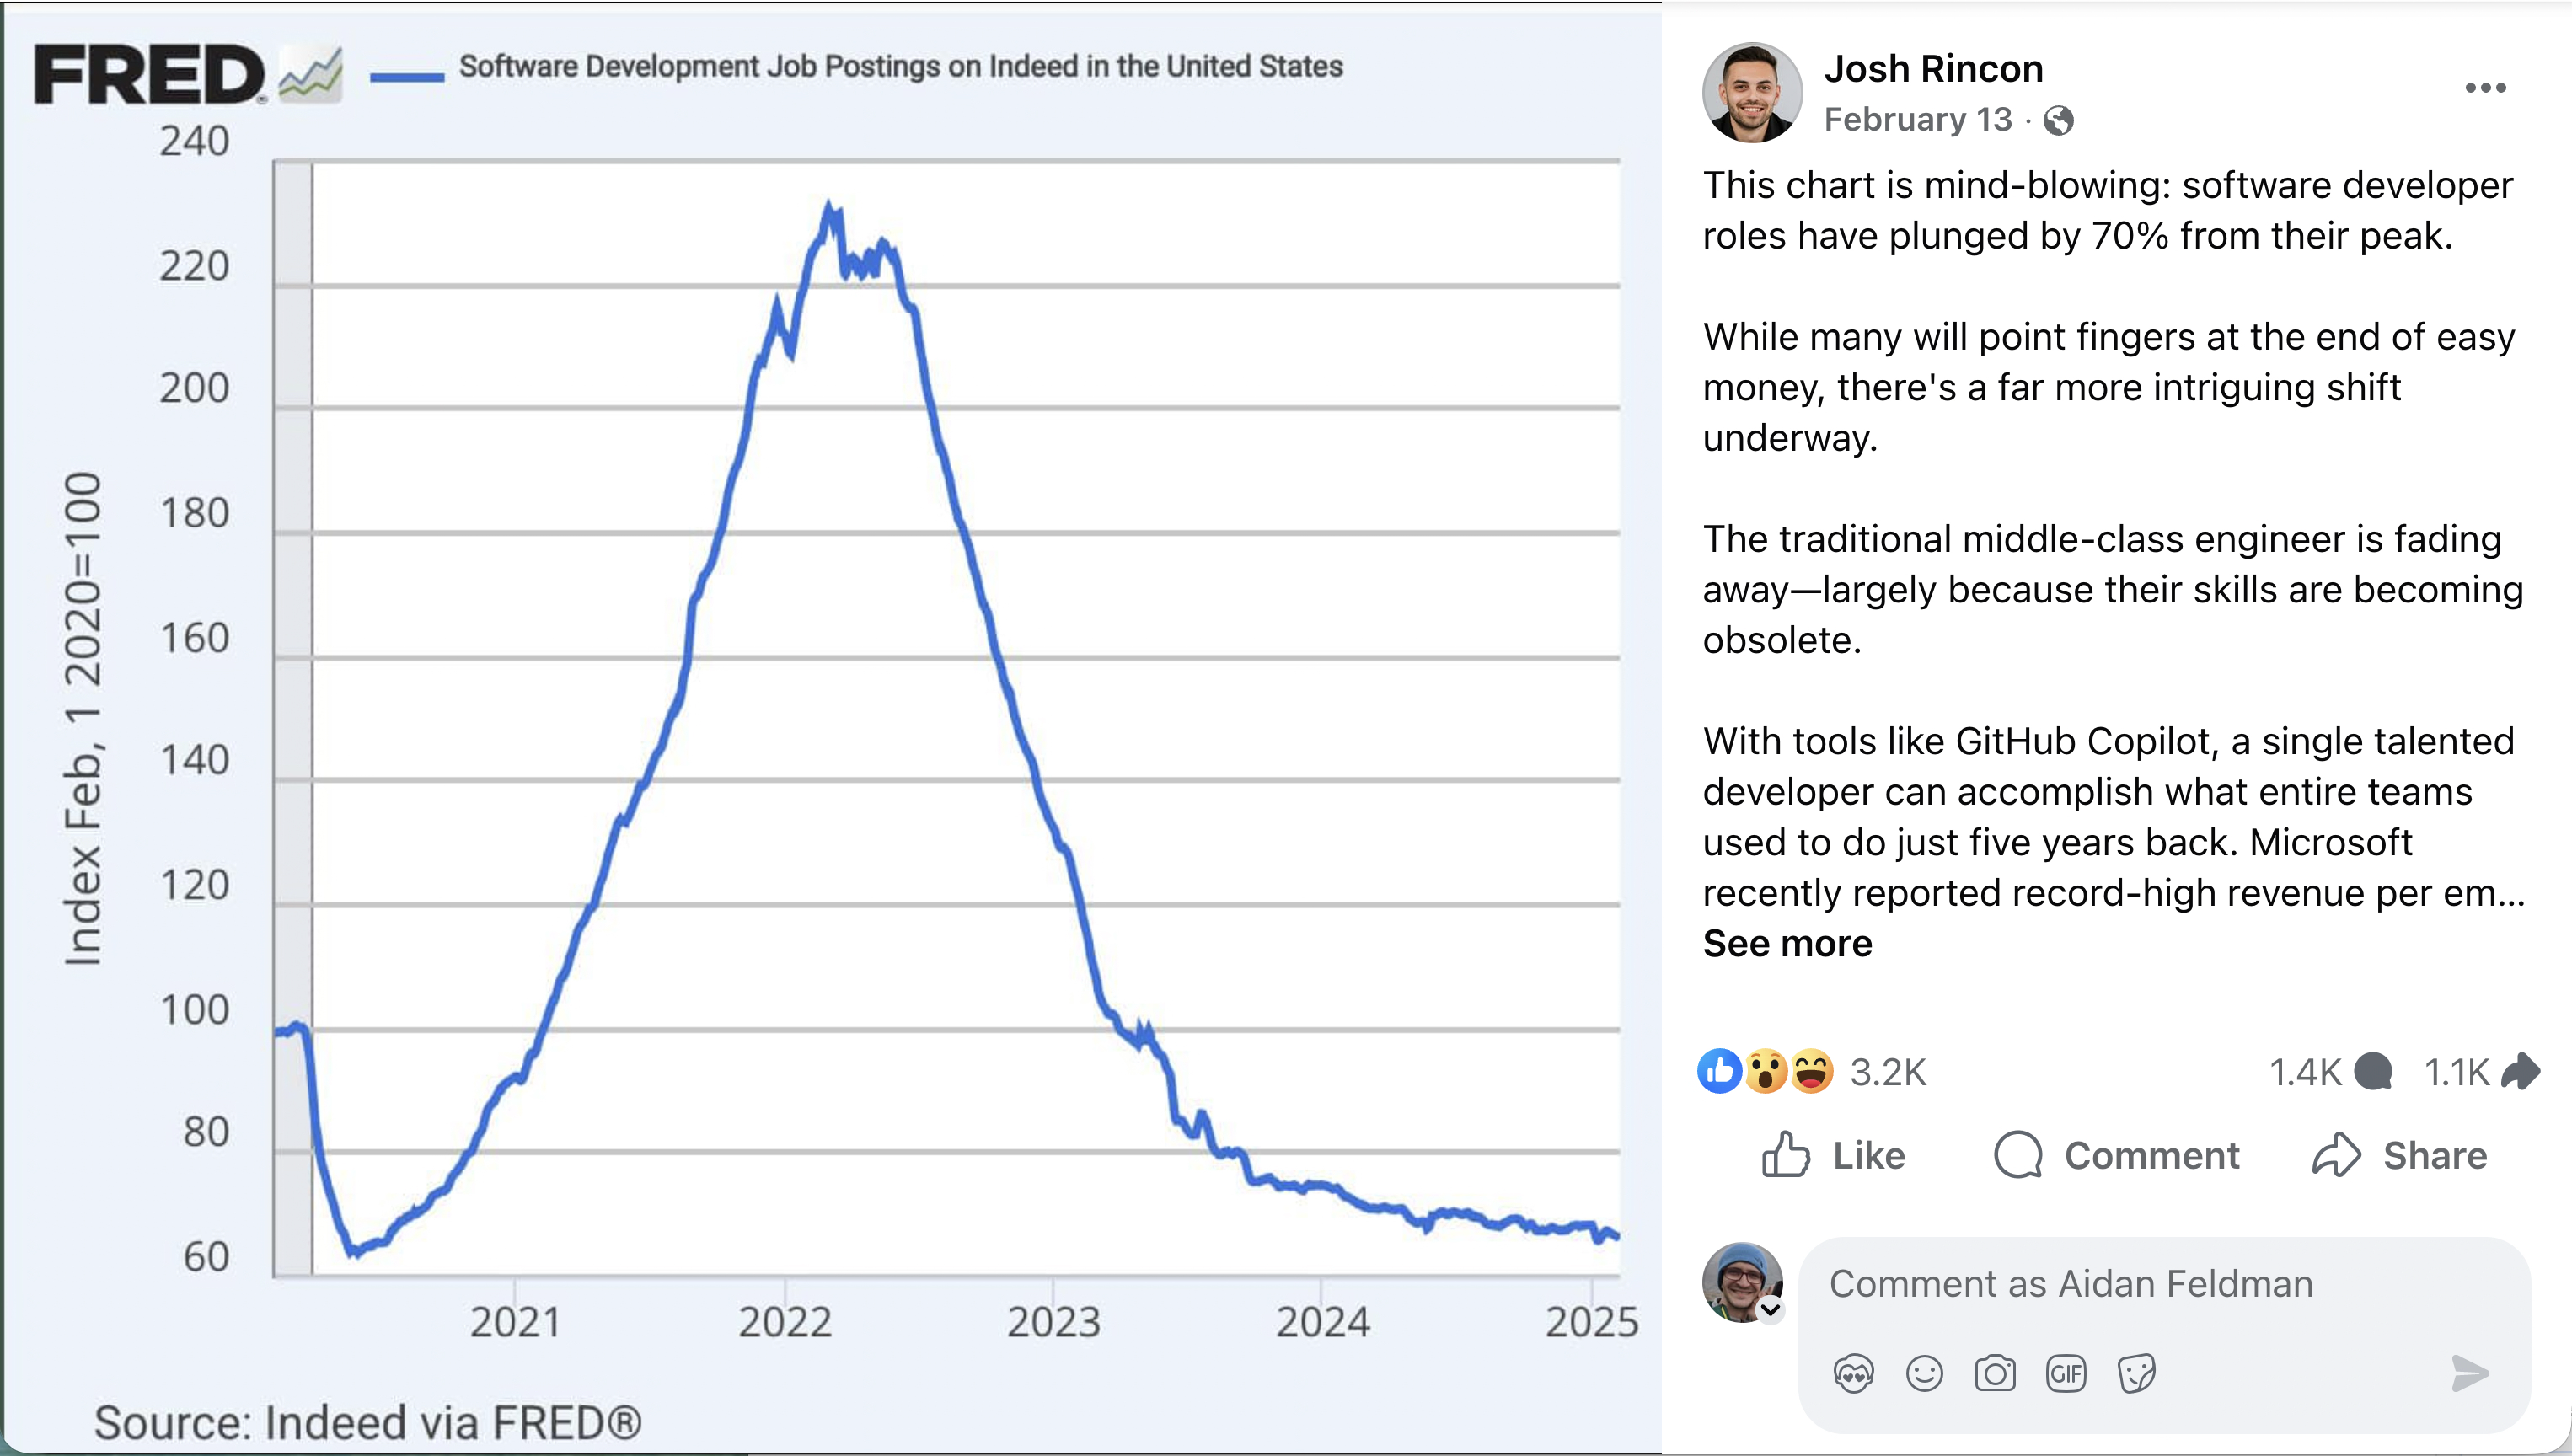
Charts in the wild#
Software Development Job Postings#
OxyContin#
Strongly recommend Dopesick
Lies, damned lies, and statistics#
Dates and time series analysis#
From Wikipedia:
A time series is a series of data points indexed (or listed or graphed) in time order. Most commonly, a time series is a sequence taken at successive equally spaced points in time.
What are time series you’ve seen / worked with?
Is the 311 data a time series?
Import necessary packages#
import pandas as pd
Example data#
cases = pd.DataFrame(
    {
        "date": ["12/30/2024", "12/31/2024", "01/01/2025", "01/02/2025"],
        "cases": [67, 29, 85, 66],
    }
)
cases
| date | cases | |
|---|---|---|
| 0 | 12/30/2024 | 67 |
| 1 | 12/31/2024 | 29 |
| 2 | 01/01/2025 | 85 |
| 3 | 01/02/2025 | 66 |
Get the minimum and maximum created_date:
cases["date"].min()
'01/01/2025'
cases["date"].max()
'12/31/2024'
Anything you notice about that?
The dates are stored as strings (objects):
cases.dtypes
date     object
cases     int64
dtype: object
Convert columns to timestamps using pandas’ to_datetime()#
cases["date"] = pd.to_datetime(cases["date"], format="%m/%d/%Y")
cases["date"]
0   2024-12-30
1   2024-12-31
2   2025-01-01
3   2025-01-02
Name: date, dtype: datetime64[ns]
More about the format string. If you don’t provide one, it will take much longer to convert.
cases["date"].min()
Timestamp('2024-12-30 00:00:00')
cases["date"].max()
Timestamp('2025-01-02 00:00:00')
Time/date components#
cases["date"].dt.day_name()
0       Monday
1      Tuesday
2    Wednesday
3     Thursday
Name: date, dtype: object
Congestion Pricing demo#
Vehicle entries per day#
How would you do this, conceptually?
Has the number of entries plateaued?
Resampling#
From the User Guide:
resample()is a time-basedgroupby
.resample("FREQUENCY", on="COLUMN")
In-class exercise#
Calculate the entries per week.
Rolling average#
Resampling with other grouping#
entries.resample("W-SUN", on="toll_10_minute_block").sum(numeric_only=True)

# can be rewritten as

entries.groupby(
    [
        pd.Grouper(key="toll_10_minute_block", freq="W-SUN"),
    ]
).sum(numeric_only=True)
This means you can add other columns to group by. Let’s do entries per day by vehicle_class.
Resampling vs. time/date components#
Use resampling when you want to work with dates as continuous values, e.g. points in time
Use date components when you want to work with dates as categorical values, e.g. month number, day of week
Can also do math between datetime columns, such as calculating durations.
Filtering timestamps#
How many vehicle entries were there in the first week?
You can also filter dates using strings, but using the Timestamp class is safer.
Final Project#
Check feedback on your proposals, even if you got 100%.